

How to read histogram? That little graph can feel cryptic, but it tells you if your image has lost dark or bright detail.
This guide shows simple steps and clear visuals. You’ll learn what a histogram is, how to read it step-by-step, how to spot clipping, and how to use your camera’s histogram.
We include annotated examples, a printable cheat-sheet, and a short practice exercise you can try on your next shoot. Follow the quick checklist and you’ll fix exposure on the spot.
Whether you shoot portraits, landscapes, or snowy scenes, this article will make reading histograms easy and practical. Ready to decode the graph and get more reliable exposures?
What is a histogram?
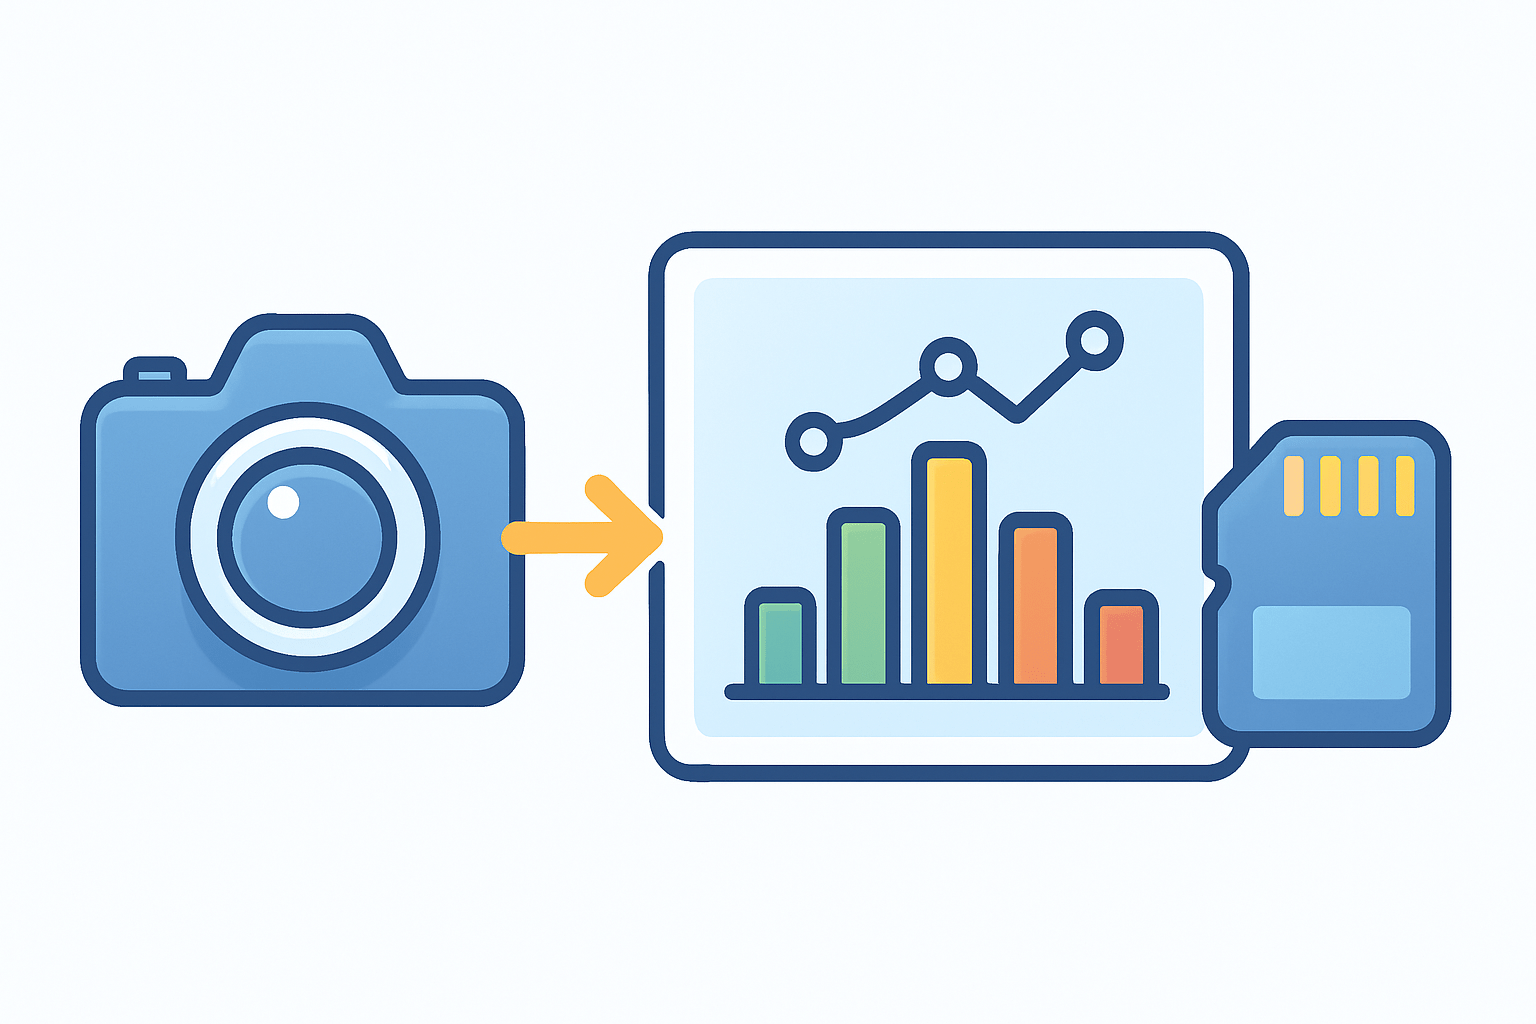
A histogram is a simple graph that shows the brightness values in a photo. If you are learning how to read histogram, think of it as a map of how many pixels are dark, midtone, or bright.
The x-axis runs from black on the left to white on the right, and the y-axis shows how many pixels sit at each brightness. There are two common types: a luminance histogram for overall brightness and RGB histograms for each color channel, and you can find a deeper explanation of how they differ.
A histogram is not a preview of detail, texture, or composition. It is a summary of tones, so it cannot tell you where highlights are located, only how many there are.
Most camera histograms are based on the camera’s JPEG preview. That means the shape you see can look different from the RAW file, especially if your picture style adds contrast or saturation.
Caption: Example image with a broad spread histogram and a small highlight bump, showing a high-contrast scene with bright sky and detailed shadows.
Quick takeaway: Left = shadows, center = midtones, right = highlights. If the graph is pressed against the edges, you may be clipping detail.
How to read a histogram: step by step
Here is how to read histogram data quickly in the field. The goal is to read the shape, spot problems, and adjust exposure with confidence.
Step 1 is to look at the overall shape. A narrow, tight hump means low contrast or flat light, while a broad spread means high contrast across the scene. A tall peak shows lots of pixels at one tone, and a flatter curve shows a more even mix.
Step 2 is to check both ends. If you see spikes touching the left edge, shadows are clipped to pure black; touching the right edge means highlights are blown. Edge spikes are your first red flags that detail is lost.
Step 3 is to find where the biggest peaks sit. A left-leaning graph means the image is dark or shadow-dominant, a center peak suggests balanced midtones, and a right-leaning graph indicates a bright or high-key look.
Step 4 is to match the histogram to the scene. A low-key portrait should be left-skewed but not clipped, while a snowy field will be right-skewed and a touch of clipping in specular whites may be fine. A high-contrast landscape often spans the whole width with energy at both ends.
Step 5 is to decide what to do. You can add or subtract exposure compensation, change shutter, aperture, or ISO, or bracket shots to cover the full range. You can also accept a high-key or low-key look if that is your creative intent.
Use this quick checklist on your camera: glance at the histogram, note if it touches the edges, adjust exposure or bracket, then re-check. Repeat until the histogram matches your intended look.
Three fast moves help in practice. If the graph is heavy on the left, add exposure by slowing the shutter or using positive compensation; if it is heavy on the right, reduce exposure until highlights pull off the edge; if it is a narrow midtone hump, add light contrast or shape light to stretch tones.
Do not assume a flat histogram is bad. Match the graph to the mood you want, and remember the histogram is global, not local, so a tiny bright sign or a small black coat can skew the curve without the whole picture being wrong.
Breaking down the histogram: axes and peaks explained
The x-axis runs from 0 to 255 in most editors, or 0.0 to 1.0 in normalized systems. Zero is pure black, 128 is the midtone center, and 255 is pure white.
The y-axis is the pixel count at each brightness value. A tall bar does not mean “strong brightness,” it only means many pixels share that tone.
Peaks are tall areas where many pixels cluster, while spikes at the very edges indicate clipping. Gaps can show missing tones and may hint at banding or a low bit-depth look when pushed too far.
The width or spread of the graph shows global contrast. A wide spread means strong contrast, while a narrow spread means low contrast or soft light; this cheat sheet view helps you judge it fast.
RGB histograms can be overlaid or shown as separate channels. A spike in the red channel reaching the right edge can mean blown red highlights, which often tint whites magenta or yellow even if the luminance histogram looks safe.
Pro tip: when whites look strange, check each color channel. Single-channel clipping can hide in the luminance view and still ruin color detail in skies, skin, and fabric.
Quick-read: Left = shadows; Center = midtones; Right = highlights; Touching edges = clipping.
Understanding clipping: highlight clipping and shadow clipping
Clipping happens when pixels are recorded at absolute 0 or 255, meaning there is no detail left to recover in that channel. Once clipped, texture is gone in the recorded file, and edits can only make it gray or colored, not detailed.
You can spot clipping when the histogram piles up against the left or right wall. Cameras often show highlight warnings called “blinkies,” and editors show clipping overlays; watch RGB channels too, because luminance alone can hide single-channel loss.
RAW files give you more headroom than JPEG, so mild clipping near the edges can sometimes be recovered. Severe clipping remains unrecoverable, so shoot conservatively if the scene has precious detail in bright clouds or deep fabrics.
To avoid clipping, lower ISO when possible and use exposure compensation to pull highlights off the right edge. ETTR, or Expose To The Right, works well if you push the graph close to the right without touching it, but bracket exposures or use a graduated ND filter when the range is too wide; in editing, use highlight and shadow recovery and verify individual channel clipping.
When is clipping acceptable? Specular highlights on chrome, sun reflections on water, or tiny light bulbs can blow out without hurting the image, but portrait skin highlights should keep detail. When to ignore the histogram: if your creative target is a high-key or low-key look and you understand the trade-offs, trust your intent and let the graph lean.
How to use your camera’s histogram
Turn on the histogram in your camera’s Live View or Playback settings; the exact path differs by brand, but it is usually in the display or overlay options. You can also enable highlight warnings so blown areas blink during review.
Remember that most cameras show a JPEG-based histogram, which can look harsher than the RAW file. Keep your picture profile neutral and contrast low if you want a conservative preview, or simply treat the in-camera histogram as a safety margin.
My in-camera workflow is simple: take a test frame, check the histogram for edge touches, adjust exposure compensation or change shutter, aperture, or ISO, then reshoot and verify. For high dynamic range scenes, bracket based on histogram coverage instead of trusting the small preview, and review before moving on for more practice tips.
Match your use to the scene. For landscapes, nudge the graph right without clipping to keep clean shadows; for low-key portraits, let the histogram lean left but protect eye and skin detail; in snow or beach scenes, expect a right-skew and watch for color-channel clipping in blues and reds.
Try this practice exercise: photograph the same scene at -1 EV, 0 EV, and +1 EV, then compare the three histograms. Open the RAW files and test highlight or shadow recovery, and note how the histogram changes with each move.
What People Ask Most
What is a histogram and why should I learn how to read one?
A histogram is a simple bar chart that shows how values spread across ranges, and learning how to read histogram helps you spot problems or patterns quickly.
How do I read a histogram on my camera or photo app?
Look left for dark tones and right for bright tones; a balanced middle peak usually means good exposure.
How to read histogram for data in spreadsheets or charts?
Check the height of each bar to see how many items fall in each range, and adjust bin sizes to reveal different patterns.
Can a histogram tell me if my photo is underexposed or overexposed?
Yes—bars clustered to the left often mean underexposure and bars clustered to the right often mean overexposure.
What common mistakes should beginners avoid when trying to read a histogram?
Don’t assume a centered histogram is always perfect, and don’t ignore context like scene type or editing goals.
How often should I check a histogram when editing or shooting?
Check it whenever you change exposure or edit tones to make sure you keep important highlights and shadows.
Will learning how to read histogram improve my photos or data analysis?
Yes, understanding histograms helps you make better exposure and editing choices for photos and find trends or outliers in data.
Final Thoughts on How to Read a Histogram
As promised at the start, if you wanted to stop guessing exposure, the histogram gives you that quick, visual answer — spend 270 seconds practicing the bracket exercise and you’ll feel it click. This guide showed how to read the graph, what peaks and gaps mean, how to spot clipping, and how to use your camera’s display so you can judge exposure without relying on a bright-or-dark preview. Beginners and seasoned shooters who want more reliable exposures — especially landscape and portrait photographers — will get the most from this approach.
Keep one realistic caution in mind: what your camera shows is usually the JPEG preview, so you may be able to recover more detail in RAW but you shouldn’t count on miracles. Also remember the histogram’s a global map — tiny specular highlights or a dark corner can skew the shape, so use it alongside your eye and highlight warnings. You’ve now got the tools and the vocabulary to read and trust this simple graph, so go experiment with intention and enjoy seeing your exposures improve.




0 Comments